Monday, May 22, 2024

MCU Power Consumption Data: What Matters Beyond the Typical Datasheet
by
Published
Views:
MCU power consumption data is rarely as simple as a single number on a typical datasheet. For operators and technical users comparing real-world performance, the most important factors often include sleep modes, dynamic load behavior, voltage conditions, clock settings, and peripheral activity. This article highlights what truly matters when evaluating MCU efficiency, helping you make more reliable decisions for system stability, energy use, and long-term industrial performance.
In cross-sector industrial systems, from sensor nodes in smart agriculture to battery-backed controllers in mobility platforms and environmental monitoring equipment, the gap between headline current figures and actual field behavior can be large. For users responsible for uptime, battery life, thermal control, or maintenance intervals, mcu power consumption data should be interpreted as an operating profile rather than a single specification line.
That distinction matters in procurement and operation. A device drawing 8 mA in one test condition may average less than 500 µA in a duty-cycled system, while another MCU promoted as low power can consume significantly more once ADCs, communication blocks, timers, memory accesses, and wake-up events are enabled. In industrial benchmarking environments such as those supported by Global Industrial Matrix, the useful question is not only “what is the current number,” but “under which workload, voltage, clock, and peripheral state was it measured?”
Why Typical Datasheet Numbers Often Mislead Operators
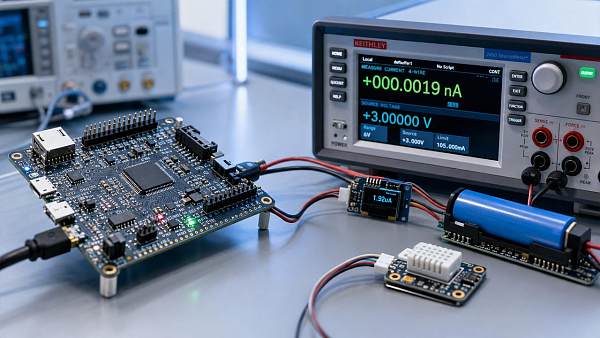
Typical datasheets are essential, but they are optimized for compact presentation. They often show “run current” at one frequency, one voltage, and one temperature band, sometimes around 25°C. In practice, operators may deploy the same controller across 3.0 V to 5.0 V rails, ambient conditions from -20°C to 70°C, and duty cycles that change every few milliseconds or every 10 minutes. Under those conditions, mcu power consumption data becomes highly context-dependent.
A common misunderstanding is to compare active-mode current from vendor A with sleep-mode current from vendor B. Another is to compare values measured with SRAM retention disabled against a competing part tested with full memory retention and multiple wake sources enabled. These comparisons can distort battery forecasting, regulator sizing, and maintenance planning by 20% to 50% in real deployments.
The 5 variables that change the meaning of a current figure
- Supply voltage: Current may rise or fall with voltage depending on architecture and regulator topology.
- Clock frequency: A change from 4 MHz to 48 MHz can multiply active consumption several times.
- Peripheral state: UART, SPI, CAN, ADC, DAC, comparators, and radio blocks add meaningful load.
- Memory behavior: Flash reads, EEPROM operations, and SRAM retention affect both peak and average current.
- Wake-up frequency: Sleeping for 900 ms and waking for 100 ms creates a very different average than a 50/50 cycle.
For industrial users, these variables are not edge cases. They are standard operating realities. A controller in a filtration monitor may sleep 95% of the time and wake every 1 second for sensor conversion, while an MCU in a traction subsystem may remain active for long windows with periodic communications every 5 ms. The same low-power claim cannot be applied equally to both.
What operators should extract from the datasheet first
Before comparing vendors, users should isolate at least 4 categories: active current per MHz, sleep current under retention, wake-up latency, and peripheral-specific current overhead. This allows a first-pass screening that is far more useful than relying on “typical current” alone.
The table below shows how common datasheet fields should be interpreted in a practical operating context rather than as standalone marketing figures.
The key takeaway is straightforward: meaningful mcu power consumption data must be normalized. Users who compare equivalent states, equivalent voltages, and equivalent workloads make better decisions on battery pack sizing, DC-DC selection, and expected service intervals.
The Operating Conditions That Drive Real MCU Efficiency
Real efficiency is shaped by how often the MCU switches states, how long it stays awake, and which blocks remain powered between tasks. In many industrial products, average current depends more on behavior over a 1-second or 10-second window than on any instant measurement. This is why mcu power consumption data should be reviewed as a time-based profile.
Sleep modes are not equal
Most MCU families offer at least 3 low-power states: idle, standby, and deep sleep. The difference can be substantial. Idle mode may preserve fast wake-up with current in the hundreds of microamps or several milliamps, while deep sleep may drop to single-digit microamps but disable parts of SRAM, PLLs, or high-speed clocks. For an operator, the best mode is the one that balances current reduction with acceptable recovery time.
For example, if a control board wakes every 20 ms, a 1.5 ms restart penalty can erase the expected savings of a deeper state. Conversely, if a remote sensor wakes every 30 seconds, choosing a mode with 5 µA instead of 150 µA may extend battery life by months. The mode decision should always be linked to wake interval, retained context, and required response latency.
Practical evaluation checklist
- List all wake sources: timer, GPIO, communication bus, analog threshold, or RTC.
- Measure the wake interval: every 10 ms, 100 ms, 1 s, or longer.
- Confirm retention needs: full SRAM, partial SRAM, registers only, or no context.
- Record startup cost: oscillator stabilization, flash fetch, and peripheral reinitialization.
- Calculate average current over one complete cycle, not just sleep current.
Voltage and clock settings change the ranking
MCU comparisons often change when the supply rail changes. One device may look efficient at 1.8 V but lose its advantage at 3.3 V if internal regulation or memory timing overhead increases. Clock scaling has a similar effect. Some architectures are efficient per MHz, but total energy per task can still be lower at a faster clock if the MCU finishes the workload quickly and returns to sleep sooner.
This is where users should think in “energy per operation” rather than current alone. A device that draws 12 mA for 2 ms may consume less total charge than one drawing 4 mA for 10 ms to complete the same job. In high-duty systems, this difference can affect thermal design and regulator margins. In low-duty systems, it can reshape battery forecasts over 6 to 24 months.
Peripheral activity is often the hidden load
ADC sampling, op amps, touch sensing, USB, CAN, Ethernet PHY interfaces, and wireless transceivers can add more current than the CPU core itself during certain windows. In industrial controller boards, peripheral usage patterns often determine whether the MCU remains within the targeted power budget.
Consider a monitoring node that samples 4 analog channels every 200 ms, transmits one packet every 5 seconds, and logs data to external memory once per minute. The processor may spend 90% of its time in a low-power state, but the actual average depends on ADC settling time, communication retries, bus pull-ups, and memory write bursts. Good mcu power consumption data therefore includes both core and subsystem behavior.
How to Compare MCU Power Consumption Data Across Industrial Use Cases
Operators in a multi-industry environment need a repeatable comparison method. The best approach is to group use cases by duty cycle, response requirement, and power source. This creates a practical benchmark that works across electronics, mobility, agri-tech, and infrastructure controls.
Three common deployment profiles
The table below provides a simple framework for reading mcu power consumption data in common field scenarios. It does not replace engineering validation, but it helps users screen options more efficiently during evaluation and procurement.
This framework helps prevent a common procurement mistake: selecting an MCU based on excellent deep-sleep numbers when the actual application is active 60% of the time. Matching the evaluation method to the deployment profile usually produces better operational outcomes than searching for the lowest standalone current figure.
A 4-step benchmarking method for technical users
- Define the workload cycle in milliseconds or seconds, including sampling, processing, communication, and idle time.
- Map each cycle segment to an MCU state: run, idle, standby, deep sleep, flash write, or transmit support.
- Estimate average current using vendor values first, then validate with bench measurements over at least 3 repeated cycles.
- Apply a design margin of 15% to 30% for temperature, component tolerance, bus contention, and firmware growth.
This method is especially useful when multiple teams are involved, such as procurement, firmware, and operations. It translates mcu power consumption data into a shared decision tool instead of leaving interpretation only to silicon specialists.
Common Mistakes in Procurement, Testing, and Field Deployment
Even well-qualified teams can make avoidable errors when evaluating low-power MCUs. In industrial environments, these mistakes may not appear during lab selection but become obvious after 3 to 12 months of deployment, when maintenance intervals shorten or battery replacement rates rise.
Mistake 1: Using only typical values
Typical numbers are useful for comparison, but they are not a guarantee of field current under every temperature, voltage, or code path. Users should review test conditions and, where possible, check maximum or conditional ranges. A controller that meets expectations at 25°C may behave differently at 60°C when oscillator, leakage, or regulator behavior shifts.
Mistake 2: Ignoring firmware architecture
Polling loops, unnecessary wake-ups, excessive logging, and poor interrupt handling can raise average current dramatically. Two products using the same MCU can differ by more than 2x in power draw because of software structure alone. For operators, this means power claims should be linked to firmware state management, not just hardware selection.
Mistake 3: Measuring without a realistic profile
Bench tests that measure only steady-state run current miss the transients that define real behavior. Sampling current at 1 Hz may overlook wake spikes lasting 50 µs to 500 µs. For low-duty devices, those spikes can still meaningfully affect the average. A more accurate test uses cycle-aware logging and integrates current over time.
Field validation recommendations
- Test at no fewer than 3 voltage points, such as low, nominal, and high supply conditions.
- Measure at both room temperature and one elevated condition aligned with deployment reality.
- Capture at least 1 full duty cycle, and preferably 10 repeated cycles for stable averaging.
- Include active peripherals, pull-up networks, and external memory or sensor interfaces during validation.
These steps do not require excessive complexity, but they turn raw mcu power consumption data into operational evidence. That is the difference between a component that looks efficient in selection and one that remains efficient in service.
What Decision-Makers and Operators Should Ask Suppliers
A productive supplier conversation should move beyond “what is the current consumption?” and toward “what is the current consumption under my use model?” This is especially important when sourcing for mixed fleets, distributed sensor systems, or industrial platforms with strict maintenance targets.
Useful technical questions during selection
- At what voltage, frequency, and temperature was the published value measured?
- Which memories, regulators, and clocks were retained or disabled in sleep?
- What is the wake-up latency from each low-power mode?
- How much additional current should be expected for ADC, serial communication, or timer operation?
- Are there reference measurement methods or application notes for average-current estimation?
For organizations managing procurement risk across multiple sectors, standardized questioning improves comparability. Platforms that benchmark components against common technical criteria can help teams filter out incomplete or non-equivalent data before the design cycle advances.
Why this matters in a broader industrial context
As electronics become embedded in vehicles, agricultural machinery, filtration systems, and infrastructure assets, power behavior has system-level consequences. It affects service intervals, enclosure temperatures, backup power sizing, and long-term reliability. Better interpretation of mcu power consumption data supports not only component selection, but also resilience planning across the supply chain and operating environment.
For users and operators, the practical goal is simple: choose the MCU whose measured behavior matches the application’s real cycle, not the one with the most attractive isolated figure. When that discipline is applied consistently, teams reduce redesign risk, improve energy efficiency, and gain more predictable field performance.
Accurate interpretation of mcu power consumption data depends on 4 essentials: equivalent test conditions, realistic duty-cycle modeling, peripheral-aware measurement, and validation under actual voltage and temperature ranges. Those factors matter far more than a single typical number when the target is stable operation across modern industrial systems.
If your team is comparing MCUs across electronics, mobility, agri-tech, or infrastructure applications, GIM can help structure the evaluation through cross-sector benchmarking logic and decision-ready technical criteria. Contact us to discuss your operating profile, request a tailored comparison framework, or learn more solutions for practical component assessment.
The Archive Newsletter
Critical industrial intelligence delivered every Tuesday. Peer-reviewed summaries of the week's most impactful logistics and market shifts.