Monday, May 22, 2024

How to Read ZLD System Energy Consumption Without Missing Hidden Cost Drivers
by
Published
Views:
For finance decision-makers, understanding zld system energy consumption is not just about tracking utility bills—it is about uncovering hidden cost drivers that affect capex, opex, compliance exposure, and long-term plant profitability. This guide helps you read energy data with a sharper lens, so you can evaluate ZLD performance beyond surface-level efficiency claims and make more defensible investment decisions.
Why finance teams often misread zld system energy consumption
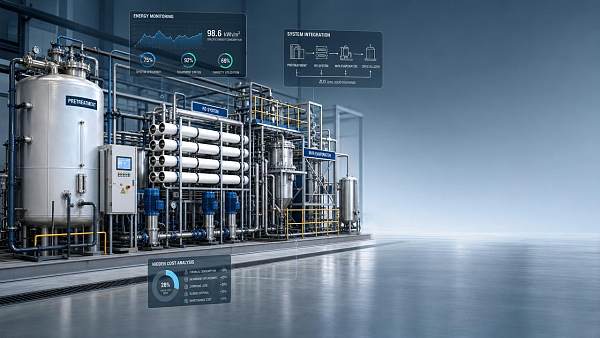
In cross-sector manufacturing, ZLD is no longer a narrow environmental utility. It can influence production continuity in semiconductor plants, wastewater recovery economics in automotive coating lines, water reuse strategies in agri-tech processing, and ESG reporting in industrial infrastructure. Yet many approval workflows still reduce zld system energy consumption to a single kWh per cubic meter number.
That shortcut creates risk. A low quoted energy figure may exclude pretreatment loads, brine concentration variability, thermal integration losses, standby consumption, chemical-cleaning penalties, or seasonal operating shifts. For a finance approver, the result is familiar: an apparently efficient proposal that later underperforms on operating margin and stretches payback periods.
Global Industrial Matrix approaches this issue as a system-of-systems problem. Instead of viewing ZLD in isolation, GIM benchmarks the entire industrial context: feedwater profile, upstream process discipline, equipment integration, standards alignment, and lifecycle cost exposure across multiple sectors. That perspective matters because hidden energy cost drivers often originate outside the evaporator itself.
- Quoted energy intensity may reflect design conditions, not real annualized operating conditions.
- Vendor proposals can separate electrical load, steam demand, and auxiliary utilities in ways that obscure total cost.
- Energy performance may depend heavily on feed chemistry, fouling rates, and plant uptime assumptions.
- A technically sound ZLD train can still create poor financial outcomes if recovery targets and maintenance cycles are mismatched to production reality.
What should you actually measure beyond the headline kWh number?
To interpret zld system energy consumption correctly, finance teams need a broader metric set. The goal is not to become process engineers. It is to ask the right questions before capital approval, especially when comparing multiple bids across sites or business units.
Core metrics that deserve boardroom attention
The table below translates technical operating data into decision-grade metrics that expose hidden cost drivers in ZLD programs. These are particularly useful when reviewing proposals for electronics, mobility, environmental infrastructure, or mixed industrial campuses where utility interactions are complex.
If these metrics are missing, you are not seeing the full zld system energy consumption profile. In finance terms, that means cost visibility is incomplete, and any NPV or IRR calculation built on it is vulnerable.
A practical review checklist for approvals
- Confirm whether the quoted figure includes only the evaporation block or the full ZLD train.
- Request load curves under minimum, normal, and peak dissolved solids conditions.
- Separate connected load from annual energy consumption and annual utility cost.
- Check whether upstream instability increases downstream concentration energy intensity.
- Model maintenance downtime and cleaning frequency into annualized cost assumptions.
Which hidden cost drivers most often distort ZLD business cases?
A credible zld system energy consumption review should move from energy quantity to energy causality. What forces the system to consume more energy over time? In GIM’s cross-industry benchmarking work, hidden cost drivers tend to fall into a small set of recurring categories.
1. Feedwater variability
Plants often budget using average influent quality. But semiconductor rinse streams, automotive pretreatment wastewater, fertilizer-linked agri-tech effluents, and mixed industrial ESG utilities can all fluctuate materially. As total dissolved solids, organics, silica, or scaling ions shift, evaporation load and cleaning frequency rise. Finance teams should ask for energy sensitivity bands, not single-point estimates.
2. Pretreatment underdesign
A weak pretreatment package may lower capex at bid stage but increase long-run zld system energy consumption. Fouling forces pumps and thermal units to work harder. In addition, membrane replacement, antiscalant use, and more frequent CIP cycles can materially shift opex. Cheap front-end decisions often become expensive rear-end operations.
3. Utility price structure
Many investment memos use a flat electricity or steam rate. Real sites rarely operate that simply. Time-of-use tariffs, fuel mix changes, steam header constraints, and demand charges can all alter economic performance. A ZLD solution that appears competitive on generic utility pricing may become less attractive on site-specific tariffs.
4. Reliability penalties
When a ZLD system disrupts water reuse or wastewater discharge compliance, the energy issue becomes a production issue. Finance should therefore connect zld system energy consumption with downtime risk, temporary hauling, emergency treatment, and compliance exposure. The real cost driver may not be energy itself, but energy-linked instability.
- Higher solids loading can increase both thermal demand and mechanical wear.
- Unstable upstream processes often create non-linear energy penalties downstream.
- Missed integration with heat recovery can lock in avoidable opex for years.
How to compare ZLD options without being misled by simplified efficiency claims
Finance approvers frequently review proposals that use different technical architectures. Some emphasize membrane concentration before thermal treatment. Others rely more heavily on evaporative concentration or crystallization. The question is not which approach sounds advanced. The question is which structure produces the most stable cost profile under your plant conditions.
The comparison table below helps normalize the evaluation of zld system energy consumption and adjacent cost implications. It is designed for multi-sector manufacturing environments where procurement teams must compare unlike proposals on a common economic basis.
This kind of side-by-side view helps finance move beyond “Which bid has the lowest quoted energy number?” to “Which configuration protects cash flow over realistic operating conditions?” That is a more reliable investment question.
What procurement teams should ask vendors before approving a ZLD budget
For finance-led review committees, the fastest way to improve decision quality is to standardize questions. GIM’s benchmarking approach is particularly helpful here because it aligns technical inquiry with procurement and operational risk, rather than leaving energy interpretation to isolated engineering claims.
A procurement-oriented question set
- What is the full zld system energy consumption at guaranteed recovery, including pretreatment, transfer pumping, thermal concentration, drying, and controls?
- Which assumptions were used for influent TDS, COD, silica, hardness, and temperature—and how sensitive is energy use if those values drift?
- What annual cleaning frequency was assumed, and how does fouling affect specific energy over time?
- Does the proposal include provisions for heat recovery, steam optimization, or integration with existing utility networks?
- How are availability, turndown, and restart energy modeled for plants with intermittent or seasonal production?
- Which standards or accepted industrial design practices were referenced in the technical basis, especially where water reuse and discharge compliance intersect?
These questions help uncover whether a proposal is robust enough for sectors where process discipline matters—such as electronics manufacturing, mobility supply chains, smart agriculture systems, and industrial environmental infrastructure. In such environments, the quality of underlying assumptions is often more important than the elegance of the brochure.
How standards, compliance, and reporting affect the energy conversation
A finance view of zld system energy consumption should also consider compliance and reporting obligations. Environmental systems do not operate in a vacuum. They influence permit strategy, discharge risk, ESG disclosures, and, in some sectors, customer qualification requirements linked to manufacturing integrity.
GIM’s cross-sector advantage is useful here because international manufacturing rarely follows one standard logic. A plant may simultaneously care about internal utility KPIs, supplier qualification procedures, ISO-aligned management practices, and customer audits informed by sector-specific expectations such as IATF or IPC-linked process discipline. Energy reporting that lacks traceability can become a governance issue, not just an engineering gap.
- Document whether energy values are measured, simulated, or vendor-guaranteed.
- Link energy use to compliance-critical operating states, especially during upsets and maintenance events.
- Ensure the accounting basis distinguishes between utility costs that belong to wastewater treatment and those shared with broader plant infrastructure.
This level of discipline improves internal approval quality and supports later audits, refinancing reviews, ESG communications, and post-installation benchmarking.
Common misconceptions about zld system energy consumption
Is lower kWh per cubic meter always better?
No. A lower figure may come from favorable test conditions, partial scope accounting, or lower recovery expectations. If a system uses less energy but also recovers less water, requires more hauling, or creates higher downtime exposure, the total economic result may be worse.
Can finance rely only on vendor guarantees?
Not fully. Guarantees are useful, but they depend on feed and operating assumptions. Finance should verify boundary conditions, exclusions, and practical penalties if the plant rarely runs under guarantee conditions. A guarantee without scenario testing is only partial protection.
Does ZLD always reduce total cost if water scarcity is high?
Not automatically. High water value improves the business case, but zld system energy consumption, chemical use, solids disposal, labor intensity, and reliability risk still matter. In some sites, optimizing pretreatment and partial recovery may produce a better interim return than moving immediately to a full ZLD architecture.
Should finance evaluate ZLD separately from production strategy?
That is a common mistake. Water recovery economics, utility load, and compliance risk are deeply linked to production mix, shift patterns, maintenance philosophy, and expansion plans. A standalone utility evaluation can miss the actual source of value or risk.
Why a benchmarking-led approach improves investment decisions
ZLD decisions are rarely simple because modern manufacturing is no longer organized in neat silos. Electronics influence mobility. Agri-tech borrows from automation. Environmental infrastructure must meet rising expectations for data transparency and resilience. That is exactly why GIM’s multi-disciplinary benchmarking model is relevant to finance approval teams.
By comparing technical assumptions across semiconductor and electronics, automotive and mobility, smart agri-tech, industrial ESG and infrastructure, and precision tooling, GIM helps decision-makers see whether a ZLD proposal is merely acceptable on paper or genuinely robust in a global manufacturing context. This reduces the odds of approving a system whose quoted energy profile looks attractive but whose lifecycle economics are weak.
- Benchmarking improves apples-to-apples vendor comparison.
- Cross-sector visibility helps identify assumptions that do not transfer well between industries.
- Structured data review supports stronger capex governance and post-award accountability.
Why choose us for ZLD energy benchmarking and decision support
Global Industrial Matrix supports finance decision-makers who need more than generic wastewater advice. We connect industrial benchmarking, procurement logic, standards awareness, and technical context across multiple manufacturing sectors, helping teams read zld system energy consumption with greater confidence and less guesswork.
You can consult GIM for practical decision support on:
- Parameter confirmation, including energy boundaries, recovery assumptions, and utility cost basis.
- Solution screening and vendor comparison for different ZLD architectures.
- Delivery and implementation planning where site constraints, production continuity, and phased investment matter.
- Standards and compliance review relevant to international manufacturing environments.
- Budgetary and quotation discussions supported by cross-sector benchmarking logic rather than isolated claims.
If your team is reviewing a new water reuse investment, validating a vendor proposal, or reassessing plant utility economics, a sharper reading of zld system energy consumption can materially improve approval quality. Bring the design basis, operating assumptions, and quotation scope into one structured review, and the hidden cost drivers become far easier to see before they affect your balance sheet.
The Archive Newsletter
Critical industrial intelligence delivered every Tuesday. Peer-reviewed summaries of the week's most impactful logistics and market shifts.