Monday, May 22, 2024

Industrial Filtration Warning Signs Before Pressure Drop Becomes Costly
by
Published
Views:
Before pressure drop disrupts uptime, industrial filtration systems usually reveal subtle warning signs that smart teams should never ignore. For professionals focused on Manufacturing efficiency, Procurement insights, and Manufacturing standards, recognizing these signals early protects equipment, supports sustainable water solutions, and strengthens data-driven maintenance decisions. This article explores how verifiable indicators help operators, engineers, and buyers reduce risk, control costs, and align performance with modern Digital foundations.
In cross-sector manufacturing environments, filtration is not a minor utility. It affects cooling loops, process water, membrane bioreactor systems, compressed air quality, hydraulic circuits, chemical handling, and wastewater treatment. A gradual rise in differential pressure often looks manageable until throughput falls, pumps overload, product quality drifts, or environmental compliance risk appears.
For operators, the challenge is practical: identify early symptoms before an unplanned shutdown occurs. For engineering evaluators and quality teams, the issue is technical: distinguish normal loading from abnormal fouling, media failure, or upstream contamination. For procurement and project leaders, the key question is commercial: when should a filter be serviced, upgraded, or replaced to avoid a higher total cost of ownership over the next 12 to 36 months?
Viewed through the GIM perspective, industrial filtration must be assessed as part of a wider system of systems. Warning signs matter not only for maintenance planning, but also for supply continuity, benchmarking against ISO-aligned practices, and digital monitoring strategies that support resilient manufacturing across electronics, mobility, agri-tech, infrastructure, and precision tooling.
Early Warning Signs That Appear Before Severe Pressure Drop
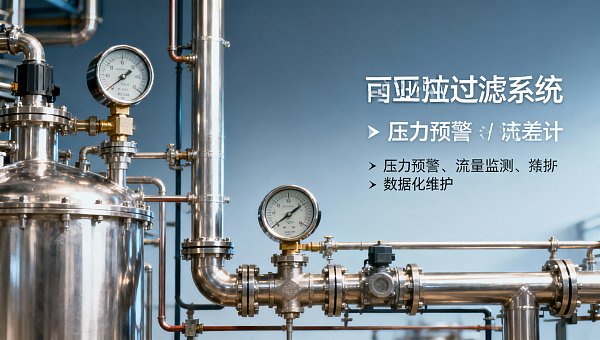
A costly pressure drop event rarely starts with one dramatic failure. In most industrial filtration systems, the first clues appear as small deviations over 3 to 10 operating cycles. These signals may include slower flow recovery after cleaning, more frequent backwash events, unstable pump amperage, or rising turbidity downstream even when differential pressure still appears within an acceptable range.
Operators often focus on a single gauge reading, but a more reliable view comes from trend behavior. For example, if a system normally runs at 0.3 to 0.8 bar differential pressure and begins spending longer periods above 1.0 bar, the issue may not yet trigger an alarm, yet it already indicates loading acceleration, media blinding, or inconsistent feed quality. In membrane or fine filtration applications, even a 10% to 15% drift in flow can be an early warning of future downtime.
Another overlooked sign is cleaning inefficiency. When a cartridge, bag, screen, or MBR module requires cleaning every 7 days instead of every 21 to 30 days, teams should investigate root causes immediately. Shortened maintenance intervals usually signal upstream solids changes, chemical imbalance, microbial fouling, seal damage, or poor filter sizing rather than normal wear alone.
Quality and safety teams should also watch for secondary effects. Increased vibration near pumps, inconsistent spray patterns, reduced heat exchange efficiency, and particle breakthrough in sensitive production lines can all emerge before the pressure drop reaches a critical limit. In electronics manufacturing and precision tooling, this stage may already affect product consistency even before maintenance teams classify the filtration unit as overloaded.
Typical symptoms by operating condition
The table below helps teams separate common warning signs from their likely operational meaning. It is especially useful for plants where multiple filtration technologies are used across utilities, process fluids, and environmental infrastructure.
The key conclusion is that pressure drop should not be monitored alone. A combined view of flow, cleaning interval, energy draw, and downstream quality provides a far earlier and more actionable warning window. In many facilities, that window is 2 to 6 weeks before a disruptive event, which is enough time to adjust sourcing, schedule maintenance, and avoid emergency purchases.
Operational checks teams can perform weekly
- Record differential pressure, flow rate, and pump current at the same shift time each week.
- Compare current cleaning frequency against the last 3 service cycles, not only against nameplate limits.
- Inspect seals, housings, and bypass paths during every planned changeout to catch mechanical leakage early.
- Sample downstream fluid quality at least once every 7 to 14 days in critical applications.
Why Pressure Drop Becomes Expensive Across Modern Manufacturing Systems
When pressure drop is allowed to escalate, the cost extends well beyond replacement media. In automotive cooling systems, clogged filtration can reduce heat transfer and stress pumps. In electronics and semiconductor support utilities, poor water or chemical filtration can increase defect risk. In smart agriculture and industrial ESG infrastructure, it can reduce treatment efficiency, increase energy use, and complicate discharge compliance.
The direct operating penalty is often measurable. A pump working against higher resistance may draw 5% to 20% more power depending on system design. If a line runs 16 to 24 hours per day, that increase becomes material over a quarter. The indirect penalty can be larger: delayed batch completion, shortened membrane life, off-spec output, emergency freight for spare elements, and technician overtime during shutdown windows.
Procurement teams also face a hidden risk when they buy only by unit price. A low-cost filter that reaches its service limit in 2 weeks instead of 6 weeks can multiply labor consumption, raise disposal volume, and increase reorder uncertainty. For distributors and commercial evaluators, this is where technical benchmarking matters more than catalog claims. Element life, dirt-holding capacity, compatibility with process chemistry, and stable supply lead times are often more important than initial purchase price alone.
Project managers should consider the chain reaction effect. One overloaded filtration stage can propagate stress to pumps, valves, sensors, membranes, and production schedules. In integrated plants, a single underperforming loop may influence utility reliability across multiple process cells. This is why many mature organizations define alarm bands at 70%, 85%, and 100% of acceptable differential pressure rather than waiting for one absolute trip point.
Cost exposure areas decision makers should map
The following comparison shows how filtration neglect can affect both technical and commercial performance. It is useful for procurement, quality, and operations teams building a cross-functional review.
The practical lesson is simple: a pressure drop problem is rarely just a maintenance issue. It is an operational efficiency issue, a sourcing issue, and in many sectors an environmental performance issue. Teams that quantify these linked costs can justify earlier intervention and stronger supplier qualification criteria.
Four common underestimation mistakes
- Using only the manufacturer’s maximum differential pressure instead of a plant-specific warning threshold.
- Ignoring how feed variability changes loading rates during seasonal, batch, or supplier shifts.
- Comparing filter media only by micron rating without reviewing dirt-holding capacity or chemical compatibility.
- Separating maintenance records from procurement records, which hides the true cost per operating hour.
How to Diagnose Root Causes Instead of Replacing Filters Too Late
A strong response begins with root-cause separation. Not every pressure rise means the filter itself is the main problem. In practice, teams should investigate five variables together: feed contamination, media selection, hydraulic design, operating cycle, and cleaning performance. If one variable is missed, replacement may solve the symptom for only a short period, sometimes less than 30 days.
Engineering evaluators should first confirm the baseline. What was the clean differential pressure at installation? What is the normal flow band? How many hours or batches were typically achieved before changeout during the last 6 months? Without this baseline, a current reading of 1.2 bar or a flow decline of 8% cannot be interpreted correctly. Data discipline matters more than isolated inspection notes.
The second step is to review upstream process changes. New raw material lots, altered pretreatment chemistry, pH drift, higher suspended solids, or temperature shifts of 5°C to 10°C can all change fouling behavior. In wastewater and MBR-related systems, biofouling may develop even when solids loading appears stable. In hydraulic and coolant filtration, fine wear particles can accumulate gradually until the pressure trend accelerates.
The third step is physical verification. Damaged pleats, collapsed cores, seal hardening, bypass leakage, and incorrect installation orientation are still common in industrial settings. These issues may coexist with fouling and can mislead teams into selecting a finer or more expensive media when the real issue is mechanical integrity or housing fit.
A practical 5-step diagnostic workflow
- Collect 30 to 90 days of trend data for differential pressure, flow, pump load, and maintenance interval.
- Compare current feed conditions with historical ranges for solids, viscosity, conductivity, pH, or temperature.
- Inspect removed elements for fouling pattern, deformation, seal wear, and signs of channeling or bypass.
- Check whether the installed filter grade, area, and compatibility still match the actual process duty.
- Validate the cleaning or replacement procedure, including torque, sealing, flushing, and restart sequence.
This workflow is especially valuable for project engineers and quality teams managing multiple suppliers. It supports a more objective discussion with vendors and distributors because it shifts the conversation from opinion to evidence. It also allows procurement to compare alternatives based on service life, cleaning recovery, and logistics resilience rather than price alone.
Signals that point to a system design issue
If new filters repeatedly reach warning pressure in less than 25% of the expected operating interval, the issue may be undersizing rather than contamination alone. If pressure fluctuates sharply within the same shift, unstable flow control or pulsing may be contributing. If downstream quality remains poor despite frequent replacement, bypass, housing mismatch, or inadequate filtration stage sequencing should be reviewed before specifying a tighter micron rating.
Selection and Procurement Criteria for Lower-Risk Filtration Decisions
For procurement officers and business evaluators, the best industrial filtration decision balances technical performance, service predictability, and sourcing reliability. A well-managed procurement process should assess at least 6 factors: filtration efficiency, pressure behavior under load, media compatibility, service interval, availability lead time, and total maintenance burden. In many sectors, a product with a 10% higher unit price may still deliver a lower annual operating cost if it lasts 1.5 to 2 times longer.
Distributors and system integrators should also examine standard alignment. Depending on the application, relevant frameworks may include ISO-driven quality procedures, IATF expectations in mobility supply chains, and IPC-related cleanliness concerns in electronics production environments. While these standards do not prescribe one filter media, they influence documentation quality, process consistency, traceability expectations, and acceptance testing discipline.
Lead time is another strategic variable. In a volatile supply environment, a nominal 2-week replacement part can quickly become a 6 to 8 week issue if the media is specialized, imported, or tied to a limited manufacturing route. That risk matters most when plants run lean inventories or use uncommon housing formats. GIM-style benchmarking is valuable here because it compares technical fit with supply resilience across sectors rather than within a single purchasing silo.
Buyers should therefore request not only datasheets, but also operating window guidance. Asking for recommended clean differential pressure, normal changeout range, cleaning limitations, chemical compatibility notes, and expected service interval under a defined solids load gives a more realistic basis for comparison. This reduces the chance of selecting a filter that performs well in theory but poorly in the actual process environment.
Procurement checklist for industrial filtration
The table below can be used by buyers, engineers, and project managers during supplier comparison. It is designed for practical B2B evaluation rather than generic product screening.
A useful rule for many industrial buyers is to compare options on cost per operating week, not cost per unit. Once labor, downtime risk, disposal, and energy are added, the ranking often changes. This is particularly important for facilities operating 3 shifts, high-load wastewater treatment, or precision manufacturing processes where filtration stability has a direct quality impact.
Questions to ask suppliers before approval
- What is the expected operating interval under a defined contamination load and flow range?
- At what differential pressure should the plant set warning, action, and shutdown thresholds?
- What field failure modes have been observed most often: fouling, deformation, seal leakage, or compatibility issues?
- What is the standard replenishment lead time, and is there a second-source strategy?
Implementation, Monitoring, and FAQ for Data-Driven Maintenance
Once warning signs are understood and procurement criteria are improved, the next step is implementation. Plants should build a simple monitoring framework that combines manual inspection with digital trend capture. Even facilities without advanced IIoT platforms can improve reliability by logging 4 core values every week: differential pressure, flow rate, energy draw, and service interval. This creates an evidence base for predictive action within 60 to 90 days.
For project leaders, the implementation sequence should be phased. Phase 1 is baseline setup over 2 to 4 weeks. Phase 2 is threshold definition and supplier alignment over the next 30 days. Phase 3 is maintenance optimization, where warning rules are linked to spare inventory planning, cleaning procedures, and quality checks. This phased approach avoids overengineering while delivering measurable control improvements.
Quality and safety managers should also define escalation triggers. For example, a 15% deviation from baseline flow, two consecutive shortened maintenance cycles, or a downstream contamination event may require technical review even if the absolute pressure limit has not been reached. Such rules are useful in wastewater treatment, process fluid management, and closed-loop cooling systems where quality drift can appear before complete filtration failure.
For organizations operating across sectors, the long-term advantage is visibility. Better filtration data supports supplier reviews, capex planning, and sustainability reporting. It also creates a stronger bridge between operators, engineering teams, and procurement, which is essential in global manufacturing environments where uptime, compliance, and sourcing resilience are closely linked.
FAQ: practical questions from operators and buyers
How often should industrial filtration performance be reviewed?
For stable systems, weekly review is usually sufficient. For high-load or variable-load applications, review every shift or every 24 hours may be more appropriate. Any system that has recently changed feed quality, chemistry, or throughput should be tracked closely for at least 2 to 3 weeks.
What pressure drop level is considered risky?
There is no universal single value because filter design and process duty vary. A better method is to define alert bands relative to baseline, such as 70%, 85%, and 100% of the plant’s acceptable operating limit. In many systems, the trend speed is as important as the absolute number.
Is frequent replacement always safer than trying to extend service life?
Not necessarily. Frequent replacement without diagnosis can hide an upstream problem and increase total cost. If service interval drops by more than 25% from normal, teams should investigate contamination change, chemistry compatibility, or installation quality before simply ordering more filters.
What should distributors and procurement teams document?
At minimum, document baseline pressure drop, normal service interval, lead time, compatibility notes, and accepted warning thresholds. These 5 data points make future sourcing, troubleshooting, and benchmarking much more reliable across sites and suppliers.
Industrial filtration warning signs are most valuable when they are treated as actionable system intelligence rather than isolated maintenance noise. Teams that monitor small deviations early can reduce downtime risk, protect quality, and avoid the compounding costs of emergency replacement, energy loss, and unstable supply planning.
For manufacturers, engineers, procurement professionals, and distributors working across complex industrial environments, a data-led filtration strategy delivers clearer decisions and stronger operational resilience. If you want to benchmark filtration performance, review warning thresholds, or evaluate lower-risk sourcing options across manufacturing systems, contact GIM to get a tailored solution and deeper technical insight.
- electronics
- electronics manufacturing
- Mobility
- sensors
- Agri-Tech
- Industrial ESG
- wastewater treatment
- filtration systems
- industrial filtration
- sustainable water solutions
- Precision tooling
- Technical benchmarking
- Operational efficiency
- Digital foundations
- Global manufacturing
- Modern manufacturing
- Procurement insights
- Manufacturing standards
- Manufacturing efficiency
- Environmental infrastructure
The Archive Newsletter
Critical industrial intelligence delivered every Tuesday. Peer-reviewed summaries of the week's most impactful logistics and market shifts.