Monday, May 22, 2024

Membrane Flux Decline Benchmark: How to Tell Normal Performance Loss From System Trouble
by
Published
Views:
A reliable membrane flux decline benchmark helps operators distinguish expected performance loss from early signs of system trouble before efficiency, water quality, or maintenance costs spiral out of control. In complex filtration environments, knowing what counts as normal decline is essential for smarter troubleshooting, cleaner operations, and more confident decisions on cleaning, replacement, and process optimization.
What does a membrane flux decline benchmark actually mean in daily operation?
A membrane flux decline benchmark is a practical reference that tells operators how fast membrane output can fall under normal conditions and when that drop is no longer acceptable. In simple terms, flux is the flow rate through the membrane per unit area, often tracked as LMH or GFD depending on system design. Decline is expected over time because membranes face fouling, scaling, biofilm formation, solids loading, temperature change, and feed variability. The benchmark becomes useful because not every drop in productivity means damage or failure.
For operators, the value of a membrane flux decline benchmark is not academic. It supports day-to-day decisions such as whether to keep running, adjust backwash frequency, trigger a clean-in-place cycle, review pretreatment, or escalate to maintenance. Without a benchmark, teams often react too late or too early. Cleaning too often raises chemical and labor costs, while waiting too long can increase irreversible fouling and shorten membrane life.
In cross-sector industrial environments tracked by platforms like GIM, benchmarking matters because membrane systems are used in wastewater reuse, MBR plants, process water polishing, food and beverage operations, chemical recovery, and environmental infrastructure. Although exact values differ by membrane type and application, the principle is the same: compare current flux behavior to a verified operating envelope rather than to guesswork.
How can you tell normal performance loss from real system trouble?
The first rule is to avoid judging flux alone. A useful membrane flux decline benchmark works best when paired with transmembrane pressure, permeability, water quality, recovery rate, and cleaning response. A small flux reduction with stable pressure may be normal aging or routine fouling. A rapid flux drop combined with rising pressure, unstable permeate quality, or frequent alarms usually points to a deeper issue.
Operators should ask three practical questions. First, is the decline gradual or sudden? Gradual decline often suggests expected fouling accumulation. Sudden decline is more likely tied to upstream upset, chemical shock, feed contamination, air scour failure, valve issues, or instrumentation error. Second, does the membrane recover after standard cleaning? Good recovery usually indicates reversible fouling. Poor recovery may indicate scaling, compaction, irreversible fouling, or membrane damage. Third, is the decline happening across the entire train or only in one skid or module? A system-wide pattern often points to feed or process conditions, while isolated decline can indicate local blockage, broken aeration, poor distribution, or hardware defects.
A strong membrane flux decline benchmark should therefore define not only a target number, but also a rate of decline, a cleaning recovery expectation, and alarm thresholds for related operating parameters. This is what helps separate “normal loss” from “system trouble.”
Which operating factors should be checked before blaming the membrane?
Many operators assume membrane decline starts at the membrane surface, but a membrane flux decline benchmark can be misleading if feed and operating conditions are not normalized. Temperature is one of the most important corrections. Cold water reduces apparent flux even when membrane condition has not worsened. Comparing winter performance directly with summer values can create false alarms.
Feed quality is another major variable. Higher suspended solids, fats, oils, grease, colloids, hardness, iron, manganese, organics, or biological activity can all change the flux trend. In MBR and industrial reuse systems, upstream process instability may be the real cause of decline. Equalization, screening, coagulation, pH control, and biological balance often matter as much as the membrane itself.
Mechanical and control issues also deserve attention. Operators should verify pump output, backwash timing, air scour intensity, valve sequencing, pressure sensor calibration, flow meter accuracy, and chemical dosing consistency. A poor membrane flux decline benchmark can result from bad data rather than poor membrane health. If instrumentation is drifting, the team may misread both baseline and decline rate.
This is why advanced benchmarking platforms in industrial ESG and infrastructure environments often normalize flux against temperature, pressure, and feed conditions. A benchmark built on normalized permeability is usually more useful than a simple raw flux number.
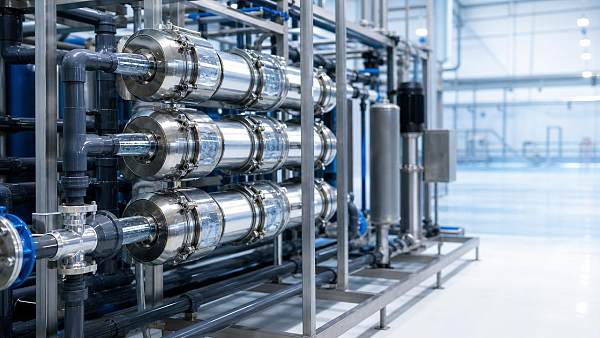
What is a practical membrane flux decline benchmark for operators to use?
There is no single universal number because membrane material, pore size, module design, feed chemistry, and cleaning strategy all affect performance. Still, operators can build a practical membrane flux decline benchmark using plant history and vendor guidance. Start with a known clean baseline under stable conditions. Then define acceptable short-term variation, expected weekly or monthly decline, cleaning trigger points, and post-clean recovery targets.
A good benchmark usually includes the following elements:
- Clean water or normalized baseline flux/permeability after commissioning or full recovery cleaning
- Expected decline range during normal production cycles
- TMP or suction pressure threshold linked to cleaning action
- Minimum acceptable recovery percentage after backwash, maintenance clean, or CIP
- Trigger conditions for process review, integrity testing, or membrane replacement planning
For example, if a system consistently loses a moderate amount of normalized flux over a production run but recovers to near baseline after routine cleaning, that may be fully acceptable. If the same system starts losing flux faster than its historical pattern and recovery falls after each clean, the benchmark is signaling a shift from ordinary fouling toward structural trouble or upstream process change.
What are the most common mistakes when interpreting membrane flux decline?
One common mistake is using vendor startup data as a permanent target. Initial flux values are often recorded under ideal conditions, not under long-term industrial reality. A membrane flux decline benchmark should be living operational guidance, updated with verified site data. Another mistake is comparing one plant to another without adjusting for feed characteristics, runtime, cleaning chemistry, or recovery objectives.
A third mistake is focusing only on cleaning frequency. More frequent cleaning does not always mean better control. Excessive chemical exposure can harm membrane life and increase downtime. Operators should judge whether cleaning restores performance efficiently, not simply whether cleaning happens often. A fourth mistake is ignoring localized failure. If one cassette, train, or pressure vessel behaves differently, averaging the whole system may hide the root cause.
There is also a business-side mistake: treating membrane decline as only a maintenance problem. In reality, flux decline affects energy demand, water recovery, chemical consumption, labor planning, spare inventory, and compliance risk. That broader view is why benchmarking is relevant not only to treatment operators but also to procurement managers, plant engineers, and industrial strategists concerned with lifecycle cost and resilience.
How should operators respond when the benchmark shows abnormal decline?
When the membrane flux decline benchmark shows abnormal behavior, operators should avoid jumping straight to replacement. A structured response usually saves time and money. First, confirm the data. Check sensor calibration, recent maintenance logs, setpoints, and control sequences. Second, compare current conditions to the baseline: feed quality, temperature, pH, solids loading, aeration, recovery rate, and chemical dosing. Third, inspect whether the decline is reversible through an appropriate cleaning protocol matched to the suspected foulant.
If cleaning does not restore expected performance, move to root-cause isolation. Review upstream process upset events, pretreatment effectiveness, oxidation exposure, antiscalant compatibility, and signs of membrane compaction or damage. In some systems, an integrity test or autopsy of one representative module may be justified. The key is to document the trend and action sequence so future benchmarking becomes more accurate.
Operators should also communicate abnormal decline in business terms. Instead of saying only “flux is down,” explain the operational impact: reduced throughput, higher kWh per cubic meter, more frequent CIP, risk to effluent quality, or approaching spare capacity limits. This improves decision speed for maintenance, procurement, and management teams.
Who benefits most from using a membrane flux decline benchmark, and in which scenarios?
The most direct users are plant operators, shift supervisors, maintenance technicians, and process engineers. They rely on the membrane flux decline benchmark to decide when to intervene and when to continue stable operation. But the benefit extends further. Procurement teams can compare membrane suppliers using real field performance instead of nameplate claims. Engineering teams can assess whether system design, pretreatment, or cleaning philosophy is fit for the feed stream. ESG and infrastructure planners can use benchmark trends to improve water reuse reliability and reduce avoidable resource consumption.
Typical scenarios include municipal and industrial MBR systems, ultrafiltration for boiler or cooling water preparation, food and beverage wastewater reuse, chemical process separation, mining water treatment, and manufacturing plants where variable influent quality makes stable filtration difficult. In all of these settings, the membrane flux decline benchmark acts as an early warning tool and a decision framework.
What should you confirm before setting or updating your own benchmark?
Before setting a site-specific membrane flux decline benchmark, confirm five things. First, define the membrane type, age, and cleaning history so the baseline is realistic. Second, normalize the data for temperature and operating conditions wherever possible. Third, separate reversible fouling from irreversible loss by tracking recovery after standard cleaning. Fourth, align the benchmark with the plant’s real production goals, whether the priority is maximum throughput, stable quality, lower energy use, or longer membrane life. Fifth, document alarm rules that tell operators what action to take at each threshold.
A benchmark is most effective when it is simple enough for the control room but detailed enough for engineering review. That means using clear dashboards, shift log notes, and routine trend checks rather than storing data without interpretation. Over time, this creates a stronger technical record for maintenance planning, supplier evaluation, and capital decisions.
Final FAQ: what should you ask first if you need a more accurate benchmark or system review?
If you need to refine a membrane flux decline benchmark for a specific system, start by asking practical questions that connect operations to decision-making. What is the normalized clean baseline? What is the historical decline rate by season and feed condition? How much performance returns after each cleaning stage? Which trains deviate from the fleet average? What upstream changes happened before the decline accelerated? What is the cost of continued operation versus earlier intervention?
For teams working with external partners, it is also smart to confirm membrane model data, recommended flux window, cleaning limits, material compatibility, expected lifecycle, and any benchmark references from similar applications. If you need to move toward a specific optimization plan, parameter review, replacement cycle, supplier comparison, or cooperation model, these are the first points worth discussing clearly.
The Archive Newsletter
Critical industrial intelligence delivered every Tuesday. Peer-reviewed summaries of the week's most impactful logistics and market shifts.