Monday, May 22, 2024

Precision Farming Data Is Growing, but Is It Usable?
by
Published
Views:
Precision farming data is expanding rapidly, but turning raw inputs into actionable intelligence remains a challenge. From smart irrigation and energy management to electronics manufacturing and PC hardware integration, usable data is what drives operational efficiency across modern agricultural systems. For stakeholders evaluating Green Mobility, precision machining, printed circuit board assembly, and even suspension systems in connected machinery, the real question is not how much data exists—but how effectively it can be trusted, benchmarked, and applied.
For procurement teams, operators, engineers, quality managers, project leaders, and executive decision-makers, this issue goes well beyond dashboards. A farm or agri-industrial operation may collect data every 5 seconds from soil probes, every 15 minutes from weather stations, and daily from ERP, telematics, and maintenance systems, yet still struggle to answer simple business questions: Which input is creating measurable yield improvement? Which asset is at risk of failure in the next 30 days? Which supplier data can be trusted during sourcing or audit review?
In a cross-sector environment where connected tractors share technology logic with automotive control systems, and irrigation platforms increasingly depend on electronics, sensor boards, edge computing, and energy infrastructure, data usability has become a technical and commercial discipline. The value lies not in raw volume, but in context, normalization, benchmarkability, and traceability.
That is where a multi-disciplinary intelligence approach matters. For organizations assessing smart agri-tech, precision tooling, industrial ESG metrics, mobility-linked machinery, or high-reliability components, usable precision farming data supports faster sourcing cycles, cleaner technical evaluations, and more defensible investment decisions.
Why Precision Farming Data Often Fails to Become Usable Intelligence
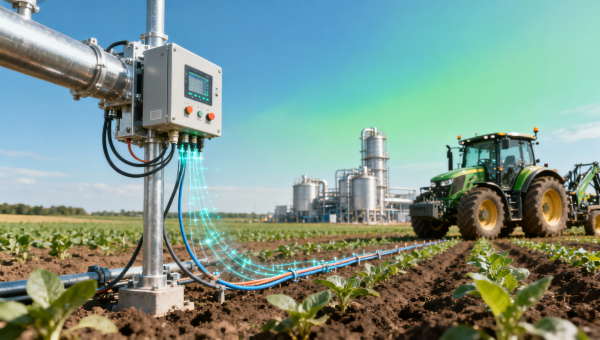
Most precision agriculture systems do not suffer from data scarcity. They suffer from fragmentation. A single operation can generate 8 to 12 data streams at once, including GNSS position data, fuel consumption, moisture readings, drone imagery, implement load, machine vibration, and field-level weather conditions. When these inputs are stored in incompatible formats, their analytical value drops quickly.
Another common problem is the gap between collection frequency and decision frequency. Sensors may capture values in real time, but managers often make purchasing, maintenance, or scheduling decisions weekly, monthly, or seasonally. If raw data is not aggregated into usable KPIs such as per-hectare energy consumption, irrigation efficiency ratio, or mean downtime per machine class, the information remains technically rich but operationally weak.
Data quality also varies significantly across hardware layers. Field devices exposed to dust, vibration, UV radiation, and water ingress can drift outside expected calibration ranges within 3 to 12 months. In connected machinery, a small signal error in a sensor node can affect downstream control logic, maintenance intervals, and even procurement decisions on replacement parts or PCB assemblies.
For business evaluators and financial approvers, the risk is not simply technical inefficiency. It is capital misallocation. If a data platform cannot distinguish between sensor noise, operator behavior, and actual equipment degradation, organizations may overinvest in upgrades, replace the wrong subsystem, or underestimate supply chain risk.
Four barriers that reduce data usability
- Lack of normalization across brands, machine generations, and communication protocols such as CAN-based systems, telematics APIs, and PLC-linked data exports.
- Missing benchmark references, making it difficult to compare one machine, irrigation zone, or electronics module against a credible range.
- Poor traceability between field events and hardware condition, especially when maintenance records, operator logs, and quality reports remain separate.
- Overfocus on data capture volume instead of decision relevance, leading to thousands of rows of data but only limited actionability.
The table below shows how raw agricultural and industrial data typically loses value if it is not transformed into benchmarked, decision-ready information.
The key takeaway is simple: raw field data becomes usable only when it is linked to thresholds, standards, expected operating ranges, and a specific decision path. Without that structure, even large datasets remain weak tools for procurement, quality assurance, and strategic planning.
What Makes Data Usable Across Smart Agri-Tech and Industrial Systems
Usable precision farming data has five core characteristics: accuracy, comparability, timeliness, contextual relevance, and auditability. Accuracy means the reading itself is dependable. Comparability means the value can be benchmarked against previous periods, alternate suppliers, or similar machines. Timeliness means the data reaches the user within the decision window, whether that window is 30 seconds for control adjustment or 2 weeks for sourcing review.
Contextual relevance is especially important in cross-sector manufacturing and agriculture. A 78°C thermal reading on an electronics enclosure may be acceptable in one operating mode but a warning sign in another. A hydraulic pressure fluctuation in an autonomous sprayer may indicate normal terrain response, or it may signal early wear in a suspension-linked subsystem. Data becomes usable only when operating context is preserved.
Auditability matters to decision-makers because modern agri-industrial systems sit inside larger sourcing and compliance frameworks. When field performance data influences component replacement, machinery procurement, or ESG reporting, each number should be traceable to a timestamp, source device, calibration status, and system version. This traceability reduces disputes between operators, quality teams, distributors, and finance departments.
For organizations comparing suppliers or evaluating technology partners, benchmark logic is often the missing layer. A data feed is not enough. Stakeholders need to know whether a machine, assembly, module, or process falls within normal tolerance, outside risk range, or above best-practice performance for a given category.
Operational criteria for usable data
- Collection integrity: sensor drift, packet loss, and downtime should be monitored at least monthly, with a corrective review cycle every 90 days.
- Reference thresholds: each KPI should have at least 3 states such as normal, caution, and critical, rather than a single pass/fail flag.
- Cross-platform mapping: machine, electronics, maintenance, and environmental data should align under one asset or process identifier.
- Decision linkage: each dashboard metric should correspond to a real action, such as inspection scheduling, irrigation adjustment, part replacement, or vendor review.
Why standards and benchmarking matter
In a connected industrial environment, comparable data is stronger than isolated data. Benchmarking against internationally recognized frameworks such as ISO process controls, IATF-style quality discipline, or IPC-oriented electronics manufacturing criteria does not require every farm to become a factory. It means technical data can be reviewed using clearer tolerance logic, validation steps, and supplier accountability.
This becomes particularly valuable when operations rely on mixed technology stacks: autonomous machines, variable-rate irrigation, filtration infrastructure, embedded boards, telematics units, and machining-intensive spare parts. In these cases, decision-makers need one language for risk, not five separate data dialects.
How to Evaluate Precision Farming Data Platforms, Hardware, and Suppliers
Selection should begin with use case definition, not feature count. A farm enterprise managing 3,000 hectares across multiple regions has different requirements from a greenhouse operator monitoring climate control every 60 seconds. Similarly, a distributor evaluating connected equipment for resale needs stronger service diagnostics and spare-part traceability than a single-site operator focused on irrigation savings.
A practical evaluation model includes technical fit, data governance, integration difficulty, lifecycle support, and financial impact. Technical fit covers sensor accuracy, communication stability, board-level durability, ingress protection, and environmental tolerance. Data governance includes ownership, exportability, audit history, and alarm traceability. Integration difficulty reflects whether the system connects to existing ERP, CMMS, GIS, and maintenance workflows in 2 weeks or drags on for 6 months.
Supplier evaluation should also include manufacturing discipline. In smart agri-tech, hardware performance depends on component quality, assembly consistency, and long-term support availability. A strong-looking dashboard cannot compensate for unreliable connectors, inconsistent PCB assembly, weak thermal design, or poor spare-part continuity after year 2.
For procurement officers and financial approvers, total cost of ownership is often more meaningful than entry price. A lower-cost sensor node may save 12% at purchase but require recalibration every 6 months, more technician visits, and higher data loss rates. The result is lower decision confidence and higher operating cost over a 24- to 36-month period.
Procurement checklist for decision-ready systems
Before approval, buyers should compare solutions using both field performance and industrial reliability criteria. The matrix below helps align technical and commercial review teams around the same questions.
A disciplined sourcing process should score each factor on a defined scale, such as 1 to 5, and require sign-off from at least three stakeholders: technical evaluation, operations, and finance. This reduces the risk of purchasing a platform that looks advanced in a demo but performs poorly in field conditions.
Common selection mistakes
- Choosing based on dashboard design instead of data lineage, tolerance logic, and export quality.
- Ignoring electronics and mechanical subsystem quality in connected machinery.
- Failing to define who owns calibration, firmware updates, and fault verification after deployment.
- Treating precision farming data as an IT purchase rather than an operations and asset-performance decision.
Implementation: Turning Multi-Source Data into Field and Factory Decisions
Implementation succeeds when organizations start with a limited, measurable scope. Instead of connecting every sensor, valve, machine, and dashboard in phase one, a better model is a 90-day rollout focused on 2 to 4 high-value use cases. Typical starting points include irrigation optimization, fuel efficiency tracking, predictive maintenance for high-use machinery, or reliability monitoring for electronics-intensive control units.
Data architecture should align physical assets with business processes. That means linking field zones, machines, components, service intervals, supplier lots, and quality events into one logic model. If a pump module, filter assembly, or control board fails, teams should be able to trace the event from sensor anomaly to maintenance ticket to sourcing action without manual rework across five spreadsheets.
Operational governance is equally important. Organizations should define who reviews alarms daily, who validates exception events weekly, and who approves threshold changes quarterly. Without this discipline, systems may collect data continuously but drift into low-trust usage after 6 to 12 months.
Training cannot be limited to software clicks. Operators need to understand what a flagged KPI means physically. Quality teams need to know when abnormal readings imply sensor recalibration versus component degradation. Commercial teams need enough technical literacy to interpret risk levels during vendor review or budget planning.
A practical 5-step deployment model
- Define 3 to 5 business-critical KPIs such as water-use intensity, machine uptime, per-acre fuel cost, or service interval compliance.
- Audit data sources and classify them as trusted, conditional, or low-confidence based on calibration, completeness, and access reliability.
- Map each KPI to thresholds, responsible teams, and response actions with a target review frequency.
- Run a pilot for 8 to 12 weeks, then compare expected and actual signal quality, decision speed, and maintenance outcomes.
- Scale only after standardizing data definitions, reporting templates, and supplier accountability terms.
Where cross-sector intelligence creates value
Modern precision agriculture is no longer isolated from broader industrial systems. Electric drivetrains, embedded control boards, filtration units, energy infrastructure, and machined components all influence field performance. A cross-sector intelligence model helps teams compare not only crop-side outcomes, but also component durability, maintenance trends, and sourcing resilience across multiple technology domains.
This is especially relevant for organizations that need technical benchmarking rather than generic software reporting. When decision-makers can review sensor outputs, assembly quality indicators, standards alignment, and operational thresholds in one framework, they gain a stronger basis for procurement, quality control, and long-term capital planning.
FAQ: Practical Questions Buyers and Technical Teams Ask
Many organizations understand that precision farming data matters, but they still need practical guidance on timing, validation, and purchasing priorities. The following questions reflect typical concerns from project managers, operators, evaluators, and distributors.
How do you know whether precision farming data is reliable enough for decision-making?
Start with three checks: calibration history, signal completeness, and threshold consistency. If a sensor has no verified calibration within the last 6 to 12 months, or if more than 5% of expected records are missing in a reporting period, decision confidence drops. Reliable data should also match known operating conditions instead of creating frequent unexplained spikes.
Which companies benefit most from benchmarked agricultural and industrial data?
The strongest fit is for organizations managing multiple assets, multiple suppliers, or multiple sites. This includes large farms, agri-equipment operators, greenhouse groups, irrigation infrastructure providers, distributors, and manufacturers of connected machinery. Any business with a 12- to 36-month asset planning cycle gains value from comparable, traceable performance data.
What should procurement teams request before approving a platform or hardware package?
Request a data dictionary, calibration plan, integration scope, support response window, and clear ownership of firmware and spare-part continuity. Buyers should also ask for sample reports showing how raw readings become decision KPIs, not just live dashboards. A platform should prove how it supports at least 3 concrete actions such as maintenance planning, input optimization, or supplier comparison.
How long does implementation usually take?
A focused pilot often takes 8 to 12 weeks, while broader multi-site integration may require 3 to 6 months depending on hardware maturity, API availability, and internal process readiness. Projects tend to move faster when KPI definitions, asset IDs, and escalation responsibilities are agreed before system connection begins.
Precision farming data is growing fast, but usable data remains the real differentiator. Organizations that structure information around benchmarks, thresholds, traceability, and decision workflows are better positioned to reduce downtime, improve resource efficiency, and make stronger sourcing choices across smart agri-tech, electronics, mobility-linked machinery, and industrial infrastructure.
Global Industrial Matrix supports this need through cross-sector intelligence, technical benchmarking, and data transparency that helps procurement teams, engineers, quality leaders, and executives evaluate systems with greater confidence. If you are reviewing connected agricultural equipment, component quality, integration risks, or supplier performance, now is the right time to build a more usable data foundation.
Contact us to discuss your application, request a tailored benchmarking approach, or explore broader solutions for smart agri-tech, industrial electronics, mobility systems, and infrastructure decision support.
- electronics
- printed circuit board assembly
- electronics manufacturing
- Mobility
- Green Mobility
- sensors
- suspension systems
- Agri-Tech
- precision agriculture
- smart irrigation
- precision farming
- Industrial ESG
- energy management
- ESG metrics
- precision machining
- PC hardware
- Precision tooling
- Technical benchmarking
- Smart Agri-Tech
- Operational efficiency
- Industrial data
- Industrial infrastructure

The Archive Newsletter
Critical industrial intelligence delivered every Tuesday. Peer-reviewed summaries of the week's most impactful logistics and market shifts.