Monday, May 22, 2024

Carbon Capture Costs to Watch in 2026
by
Published
Views:
As 2026 budget cycles tighten, carbon capture is moving from a sustainability concept to a capital allocation decision.
The key question is no longer whether emissions can be reduced, but whether project economics can survive real operating conditions.
This article examines carbon capture cost factors across industrial scenarios, supplier claims, energy penalties, policy incentives, and long-term infrastructure exposure.
Carbon Capture Costs to Watch in 2026: Scenario Signals
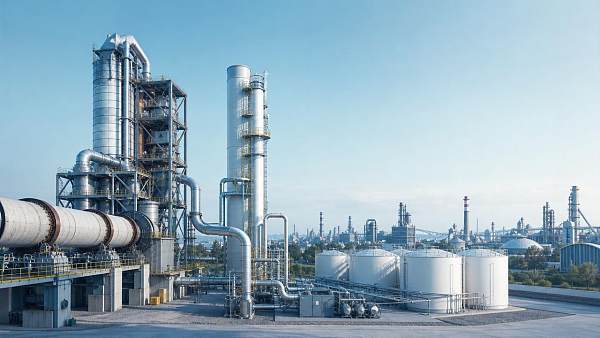
Carbon capture economics vary sharply by site, sector, flue gas profile, energy access, and storage route.
A cement kiln, hydrogen plant, steel furnace, and gas turbine may all need different carbon capture assumptions.
In 2026, cost benchmarking must move beyond headline capture rates and compare full lifecycle exposure.
Global Industrial Matrix evaluates carbon capture through cross-sector data, technical comparability, and operating integrity.
That view matters because industrial decarbonization rarely happens inside one isolated technology category.
Carbon capture may interact with power electronics, mobility supply chains, water systems, automation, and ESG reporting infrastructure.
Why Cost Judgment Changes by Industrial Scenario
Carbon capture cost is not one number. It is a stack of site-specific variables.
The largest differences often come from carbon concentration, gas impurities, plant uptime, steam availability, and compression distance.
A high-purity process stream can support lower carbon capture cost than a diluted exhaust stream.
Yet a lower capture cost may still fail if pipeline access, permitting, or monitoring liabilities are weak.
For 2026 planning, the stronger question is scenario fitness, not technology popularity.
A practical assessment links emissions profile, energy penalty, storage availability, and commercial incentives into one decision framework.
Scenario One: Cement and Lime Plants With Hard Process Emissions
Cement and lime operations are central carbon capture candidates because process emissions cannot be solved by electrification alone.
The cost driver is not only equipment. It includes kiln integration, heat balance, dust control, and downtime risk.
For this scenario, carbon capture projects should test solvent degradation, particulate tolerance, and maintenance frequency.
A low quoted cost per ton may hide expensive cleaning systems or unplanned shutdown exposure.
The strongest business case often appears where clinker output is stable and storage infrastructure is near.
Carbon capture also supports customers demanding lower embodied carbon in infrastructure, buildings, and public procurement programs.
Scenario Two: Hydrogen, Ammonia, and Refining With Concentrated Streams
Hydrogen, ammonia, and refining facilities often present concentrated CO2 streams from reforming or gas processing units.
These conditions can reduce capture complexity and improve project economics compared with diluted combustion exhaust.
However, carbon capture cost still depends on compression, drying, transport specifications, and long-term storage fees.
The key scenario judgment is whether existing process integration lowers total capital intensity.
Carbon capture for low-carbon hydrogen can be attractive when product premiums or policy credits are bankable.
Weak offtake contracts can quickly weaken the same project, even with technically favorable gas streams.
Scenario Three: Steel and High-Temperature Manufacturing
Steel, glass, ceramics, and other high-temperature sectors face complex emissions patterns and changing fuel strategies.
Carbon capture may compete with hydrogen, electrification, material substitution, or process redesign.
In this scenario, carbon capture cost should be compared against transition pathways, not only against current emissions fees.
Retrofit constraints can raise installed cost through ducting changes, space limitations, and production disruption.
Projects also need sensitivity analysis for feedstock shifts, scrap availability, and future furnace configurations.
Carbon capture is strongest where emissions are persistent and alternative abatement routes remain technically uncertain.
Scenario Four: Power, Data Centers, and Flexible Energy Assets
Gas-fired power and backup energy assets raise a different carbon capture challenge: variable utilization.
Capture systems prefer steady operation, but grids increasingly demand flexibility and rapid response.
Carbon capture cost can rise when assets run fewer hours or cycle frequently.
This matters for data centers, industrial parks, and resilient energy systems balancing reliability and emissions targets.
The core judgment is capacity factor. A high capture rate does not guarantee a low annualized cost.
Electricity price volatility also affects solvent regeneration, compression power, and auxiliary equipment economics.
Scenario Five: Waste, Biogas, and Environmental Infrastructure
Waste-to-energy, biogas upgrading, and wastewater-linked energy systems may offer niche carbon capture opportunities.
These scenarios can connect decarbonization with circular economy value, methane control, and municipal infrastructure planning.
Carbon capture cost depends on gas cleanup, moisture control, contaminants, and connection to utilization or storage pathways.
Biogenic CO2 can create special value where verified removals or low-carbon fuel credits apply.
Yet verification quality becomes critical. Poor measurement can reduce the financial value of captured carbon.
For this scenario, monitoring, reporting, and verification systems deserve early budget attention.
Cost Differences That Matter Across Scenarios
The table shows why carbon capture comparison requires scenario-based benchmarking, not generic vendor ranking.
The same technology may be economical in one setting and fragile in another.
What to Include in a 2026 Carbon Capture Cost Model
A credible carbon capture model should separate capital cost, operating cost, financing risk, and revenue assumptions.
- Installed equipment, civil works, utilities, controls, and integration engineering.
- Energy penalty from steam, electricity, cooling, compression, and solvent regeneration.
- Consumables, sorbent replacement, solvent makeup, catalysts, filtration, and waste handling.
- Transport, storage, monitoring, insurance, liability, and long-term stewardship fees.
- Policy credits, carbon pricing, product premiums, and verified emissions reductions.
The most useful metric is often levelized cost per verified ton, not cost per captured ton.
Verification adjusts carbon capture economics for leakage, measurement uncertainty, uptime, and storage acceptance.
Scenario Adaptation Recommendations for 2026
Carbon capture projects should begin with emissions mapping and infrastructure screening before supplier selection.
This prevents early bias toward technology claims that do not fit site constraints.
- Classify emissions by concentration, flow rate, impurity profile, and operating hours.
- Map nearby storage, pipeline, utilization, port, or hub access options.
- Compare carbon capture against electrification, efficiency, fuel switching, and material changes.
- Stress test economics under energy price, policy, downtime, and carbon value changes.
- Request performance guarantees tied to verified tons and defined operating envelopes.
A phased approach can reduce capital exposure. Feasibility, pilot testing, and modular expansion should remain linked.
Carbon capture decisions improve when technical benchmarking and financial modeling use the same boundary conditions.
Common Misjudgments That Distort Carbon Capture Economics
The first misjudgment is treating capture percentage as the main financial indicator.
A high capture rate can still be costly if energy demand, downtime, or transport fees are high.
The second misjudgment is ignoring balance-of-plant work, especially cooling, water treatment, compression, and electrical upgrades.
These supporting systems can materially change carbon capture cost and implementation schedule.
The third misjudgment is assuming policy incentives are equivalent to cash certainty.
Eligibility rules, verification standards, tax capacity, contract structure, and timing can affect realizable value.
The fourth misjudgment is underestimating long-term storage obligations and measurement requirements.
Carbon capture is not complete when CO2 leaves the stack. Accountability continues through the storage chain.
How GIM Supports Scenario-Based Carbon Capture Decisions
Global Industrial Matrix connects carbon capture analysis with broader industrial benchmarking across manufacturing systems.
Its cross-sector view helps compare emissions technologies against electronics, mobility, agri-tech, infrastructure, and precision tooling needs.
This matters because carbon capture projects require reliable hardware, controls, sensors, filtration, data systems, and certification discipline.
Benchmarks aligned with ISO, IATF, IPC, and related technical standards support transparent supplier comparison.
For 2026, stronger decisions will come from verifiable data, not isolated sustainability narratives.
The practical next step is to build a site-specific carbon capture scorecard.
It should rank cost exposure, infrastructure readiness, policy certainty, operational disruption, and verification quality.
With that framework, carbon capture becomes a disciplined investment choice for resilient industrial decarbonization.
The Archive Newsletter
Critical industrial intelligence delivered every Tuesday. Peer-reviewed summaries of the week's most impactful logistics and market shifts.