Monday, May 22, 2024
Water purification systems often miss this maintenance cost
by
Published
Views:
Water purification systems are often judged by upfront price and filtration performance, yet one overlooked maintenance cost can quietly reshape total ownership economics. For buyers, operators, and technical evaluators working across water purification, wastewater treatment, smart power grids, and sustainable agriculture, understanding lifecycle service demands is as critical as meeting ISO standards. This article highlights the hidden expense that influences reliability, procurement decisions, and long-term operational efficiency.
Why membrane fouling management is the maintenance cost many buyers underestimate
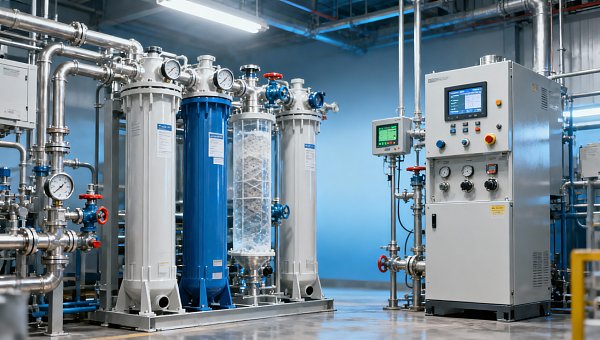
In many water purification systems, the hidden cost is not the filter cartridge alone. It is the full burden of membrane fouling management: cleaning chemicals, downtime, labor, water loss during backwash, sensor calibration, and earlier-than-expected replacement cycles. Whether the system uses RO, UF, NF, or MBR process stages, fouling control can shift annual operating cost far more than many procurement spreadsheets predict.
This issue matters across a broad industrial landscape. In electronics manufacturing, unstable water quality can affect rinse performance and yield. In food-related processing and smart agriculture, reduced flow can interrupt irrigation or nutrient delivery. In environmental infrastructure, fouling can lower treatment capacity over periods as short as 4–12 weeks if feedwater variability is not monitored closely.
The reason it is overlooked is simple. Suppliers often present flow rate, rejection rate, and equipment footprint clearly, but lifecycle service intensity is less visible at the quotation stage. A plant manager may approve a system with attractive capital expenditure, only to discover that routine chemical cleaning every 2–8 weeks and membrane replacement every 12–36 months changes the economics entirely.
For procurement teams, the lesson is direct: a water purification system should be evaluated as a service-dependent asset, not only as installed hardware. Global Industrial Matrix supports this view by benchmarking cross-sector equipment against real operational variables, helping technical and commercial teams compare filtration modules, cleaning intervals, utility loads, and compliance exposure in a single decision framework.
What is usually included in fouling-related maintenance cost?
- Planned cleaning cycles, often every month or every quarter depending on feedwater quality, temperature, turbidity, hardness, and biological load.
- Unplanned downtime caused by pressure drop, flow decline, or conductivity drift that forces operators to stop production or reduce throughput.
- Replacement parts beyond the membrane itself, including seals, housings, dosing pumps, pre-filters, antiscalant lines, and instrumentation checks.
- Waste handling and compliance cost for spent cleaning solutions, concentrated reject streams, and documented maintenance records required by internal quality systems.
How this hidden cost affects different operating scenarios
Not all users experience membrane fouling in the same way. A small commercial unit may absorb maintenance through occasional service visits, while an industrial plant sees the impact as production risk. In multi-line manufacturing, even a 2–6 hour interruption can affect cleaning-in-place scheduling, rinse water availability, or discharge compliance planning. That is why water purification system maintenance must be tied to the actual operating scenario.
Feedwater instability is one of the biggest cost drivers. Surface water, reclaimed water, agricultural runoff, and mixed-source municipal supply each introduce different fouling patterns. High suspended solids raise pre-treatment load. Hard water increases scaling tendency. Organic-rich water raises biofouling risk. If system design ignores these variables, maintenance frequency rises and membrane life shortens.
For project managers and quality teams, the practical question is not whether fouling will happen, but whether the system architecture contains it efficiently. A robust design may spread cost across staged pre-treatment, conductivity monitoring, and scheduled cleaning windows. A weak design pushes cost into emergency service calls, inconsistent output quality, and missed delivery commitments.
GIM’s cross-disciplinary perspective is especially useful here. Water treatment assets increasingly sit inside larger industrial ecosystems such as battery plants, automated farms, automotive coating lines, and ESG-driven infrastructure upgrades. Benchmarking maintenance burden across these adjacent sectors helps buyers understand where hidden service costs can trigger broader supply chain or compliance consequences.
Typical operating scenarios and where maintenance cost escalates
The table below shows how hidden maintenance cost often shifts by application context. The issue is rarely just water quality alone; it is the interaction between water source, duty cycle, staffing, and process sensitivity.
A key takeaway is that the same water purification system can produce very different total ownership results depending on service discipline and upstream control. That is why technical evaluation should include scenario-specific maintenance modeling, not just nominal performance at commissioning.
What procurement teams should compare before approving a water purification system
Procurement mistakes often begin with incomplete comparison criteria. If one quotation highlights membrane rejection and another highlights skid price, teams may assume they are evaluating equivalent offers. They are not. A proper comparison needs at least 5 core dimensions: pre-treatment adequacy, cleaning frequency, replacement interval, monitoring requirements, and service response assumptions.
Finance approvers also need cost timing, not just cost totals. A lower capital price can hide higher expense in the first 6–18 months if the system requires repeated chemical cleaning or early membrane changeout. For distributors and resellers, the same issue affects warranty burden and after-sales workload. A system that looks easy to sell may become expensive to support.
Technical evaluators should request operating windows in practical terms: feedwater TDS range, turbidity tolerance, pressure drop threshold, cleaning trigger values, and expected membrane life under normal conditions. If these are vague, lifecycle maintenance cost becomes hard to predict. In cross-industry procurement, benchmark language matters because different sectors define acceptable risk differently.
This is where GIM adds value. By aligning filtration modules and related hardware against ISO, IPC, IATF-style discipline in documentation and technical benchmarking logic, GIM helps teams move from feature comparison to system-level decision quality. The result is stronger vendor questioning and fewer surprises after handover.
A practical comparison matrix for hidden maintenance cost
Use a structured comparison table during RFQ review. This helps buyers, engineers, and project leaders convert hidden maintenance issues into visible approval criteria.
A useful rule is to compare offers over a 12-month and 36-month horizon, not only at purchase order stage. This reveals whether a lower quote truly reduces cost or simply delays it into operations.
A 4-step procurement check before final approval
- Define source water variability by season, supplier, or process shift rather than assuming one stable inlet condition.
- Request maintenance assumptions in writing, including cleaning cycles, consumables, and replacement parts over 1–3 years.
- Review downtime exposure in hours, staffing, and production dependency, especially for continuous operations.
- Validate compliance needs for water quality, waste discharge, and internal QA documentation before selecting a lower-cost option.
How to reduce maintenance burden without compromising compliance or performance
Reducing hidden maintenance cost does not mean buying the cheapest membrane or extending service intervals blindly. It means designing the system so fouling forms more slowly, is detected earlier, and is removed with less disruption. In practice, that starts with upstream control and disciplined operating windows rather than reactive maintenance alone.
Operators can often gain measurable stability through better pre-filtration, correct antiscalant dosing, regular integrity checks, and trend-based monitoring of differential pressure and conductivity. Even basic routines performed weekly or monthly can prevent the type of severe fouling that forces aggressive chemical cleaning. For many facilities, the cheapest service event is the one avoided through early intervention.
Project owners should also examine whether the selected purification architecture matches process sensitivity. A highly polished water loop may be justified in one application, while another can achieve target quality with a more service-friendly staged system. The right answer depends on end-use risk, not prestige specifications. In procurement, overdesign and underdesign can both create avoidable maintenance cost.
Across industrial ESG and infrastructure projects, maintenance transparency is becoming part of responsible asset planning. If water reuse targets, discharge obligations, and energy efficiency goals are all in scope, then membrane fouling management should be treated as a strategic operating variable. GIM helps organizations compare these interactions across sectors rather than in isolation.
Maintenance reduction priorities that usually deliver the best return
- Improve pre-treatment selection so suspended solids, hardness, and biological load are reduced before reaching the core membrane stage.
- Set cleaning triggers using pressure and flow trends instead of waiting for severe output decline or quality failures.
- Standardize operator routines through 3-shift or daily checklists that capture abnormal readings before downtime escalates.
- Align spare parts planning with expected 6-month, 12-month, and 24-month replacement events to avoid emergency procurement.
Standards and compliance factors buyers should not ignore
While standards do not eliminate hidden maintenance cost, they improve decision discipline. Buyers should check whether materials, traceability, pressure ratings, electrical integration, and documentation practices align with the project environment. In integrated industrial sites, the purification system may interact with plant-level quality systems, environmental reporting, and customer audit requirements.
Common references include ISO-based management structures, sector-specific customer requirements, and documented commissioning protocols. The exact standard set depends on the application, but the principle is consistent: if maintenance records, alarm logic, and service procedures are poorly documented, hidden cost becomes harder to control and harder to justify to auditors or finance reviewers.
FAQ: what decision-makers ask before investing in a water purification system
The questions below reflect common search intent from researchers, operators, procurement teams, and business approvers. They focus on the maintenance cost issue that often stays unclear until after installation.
How do I know whether a low-priced system will become expensive to maintain?
Ask for a written 12-month consumables and service estimate, then compare it with a 24–36 month replacement roadmap. If the supplier cannot define cleaning frequency, membrane life assumptions, spare parts needs, or acceptable feedwater ranges, the maintenance burden is not well controlled. Low capital cost without service transparency is a risk signal, not a savings guarantee.
Which water purification systems are most sensitive to hidden fouling cost?
Systems using tight membrane separation such as RO and some NF setups can be highly sensitive when pre-treatment is weak or feedwater changes quickly. MBR systems also require close attention because biological conditions and aeration quality influence fouling behavior. The exact sensitivity depends on the process chain, but any design with narrow operating tolerance deserves closer lifecycle review.
What should operators monitor every week or every month?
A practical routine includes flow rate, differential pressure, conductivity or TDS where relevant, visual inspection of pre-filters, and records of chemical dosing or flush events. Weekly trending is useful for stable systems, while variable-source systems may need daily checks. The goal is to spot early movement, not wait for a shutdown or quality complaint.
Is membrane replacement always the largest maintenance cost?
Not always. In many facilities, downtime, labor, cleaning chemicals, reject water loss, and emergency callouts can equal or exceed the membrane replacement bill. That is why total cost of ownership should include service frequency and operational disruption, not just the price of replacement elements.
Why work with GIM when evaluating lifecycle cost, sourcing risk, and technical fit
Water purification systems now sit inside broader manufacturing, infrastructure, and ESG ecosystems. A decision that looks acceptable in isolation may create hidden risk in quality assurance, utility planning, sourcing resilience, or distributor support. Global Industrial Matrix helps decision-makers connect those dots with cross-sector benchmarking rather than single-vendor narratives.
For procurement officers, GIM can support parameter confirmation, supplier comparison logic, and lifecycle cost screening across 3 key layers: hardware configuration, operational service demand, and standards-driven documentation. For engineers and project leads, the value lies in technical context that bridges water treatment with adjacent systems in electronics, mobility, agriculture, and environmental infrastructure.
If you are reviewing a new installation, retrofit, or regional sourcing program, contact GIM to discuss membrane maintenance assumptions, configuration trade-offs, expected service intervals, compliance considerations, and delivery planning. You can also request support for sample evaluation logic, quotation comparison, supplier risk screening, or application-specific benchmarking across different industrial scenarios.
The most expensive maintenance cost is often the one left out of the original decision model. By clarifying fouling-related cost early, teams can protect budget accuracy, system uptime, and long-term operational efficiency before approval turns into avoidable after-sales expense.
The Archive Newsletter
Critical industrial intelligence delivered every Tuesday. Peer-reviewed summaries of the week's most impactful logistics and market shifts.