Monday, May 22, 2024

Procurement Insights Metrics That Expose Supplier Risk Early
by
Published
Views:
Why do procurement insights metrics matter earlier than most teams expect?
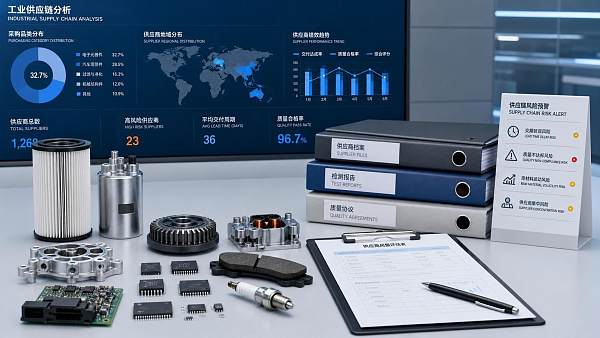
Procurement insights metrics have moved from reporting tools to early-warning signals. That shift matters because supplier risk rarely starts with a factory shutdown or a missed delivery.
It usually begins with smaller changes. Lead times stretch. Defect trends rise slightly. Response times slow. Audit findings stay open longer than expected.
For industrial supply chains, those signals often cross sectors. A substrate shortage can affect electronics, mobility systems, smart equipment, and environmental infrastructure at the same time.
That is why Procurement insights metrics are so valuable in complex sourcing environments. They help identify hidden exposure before operational performance is damaged.
In practical terms, the goal is not to measure everything. The goal is to track a focused set of indicators that reveal supplier stability, technical capability, and recovery capacity.
Cross-sector benchmarking becomes important here. When components, tooling, filtration systems, and mobility hardware share upstream dependencies, isolated scorecards stop being enough.
A broader intelligence view, similar to the way GIM maps performance across electronics, automotive, agri-tech, ESG infrastructure, and precision tooling, makes the metrics far more actionable.
Which Procurement insights metrics expose supplier risk before a disruption becomes visible?
The most useful Procurement insights metrics are not always the most obvious. On-time delivery matters, but it often reacts after risk has already formed.
Earlier indicators usually sit one layer deeper. They show whether a supplier is losing control of process discipline, capacity balance, or compliance reliability.
A strong baseline often includes the following:
- Lead-time volatility, not just average lead time.
- Schedule adherence across the last three to six production cycles.
- Corrective action closure rate after quality incidents or audits.
- PPM drift by product family, tool set, or production line.
- Capacity utilization against confirmed order mix.
- Change notification frequency for materials, sub-tier sources, or process steps.
- Certification status against ISO, IATF, IPC, or sector-specific requirements.
- Financial stress indicators tied to payment terms, inventory turns, or abnormal pricing requests.
More advanced organizations also watch engineering responsiveness. When technical questions remain unresolved, future delivery risk usually rises, especially for customized industrial assemblies.
The same logic applies to ESG and infrastructure-linked sourcing. Environmental nonconformance, water treatment instability, or energy dependence can quickly become procurement risk signals.
A helpful way to organize those metrics is to separate lagging metrics from leading ones:
How can you tell which metrics actually matter for your sourcing model?
Not every metric deserves the same weight. A useful Procurement insights metrics framework starts by matching the metric to the sourcing consequence.
If a delayed component can halt a full production system, continuity metrics should lead. If a part affects compliance, traceability and certification metrics should carry more weight.
This is where many organizations overcomplicate the model. They collect dozens of data points but do not connect them to operational outcomes.
A cleaner method is to score suppliers against four decision lenses:
- Supply continuity: Can the source absorb disruption without stopping flow?
- Technical integrity: Can the source maintain performance against required standards?
- Commercial resilience: Can pricing, terms, and inventory remain stable under pressure?
- Governance confidence: Can the source support auditability, compliance, and change control?
In actual deployment, metric selection should also reflect product complexity. An EV powertrain component and a filtration module do not carry the same risk profile.
That is one reason cross-disciplinary benchmarking matters. Platforms like GIM help compare different industrial categories against shared performance logic instead of isolated supplier opinions.
The result is better decision speed. Teams stop debating whether a signal is meaningful because the threshold and context are already defined.
What usually gets missed when companies build a supplier risk dashboard?
The biggest gap is confusing visibility with insight. A dashboard can look complete while still failing to expose early supplier risk.
One common issue is relying too heavily on historical averages. A supplier with acceptable annual delivery can still be entering a dangerous volatility phase.
Another missed point is sub-tier dependence. If several approved suppliers rely on the same chemical input, semiconductor substrate, forged blank, or logistics corridor, the real risk is shared.
Procurement insights metrics should therefore include concentration indicators, not only supplier-level scorecards. Without that layer, dual sourcing may offer less protection than it appears.
A third blind spot is compliance drift. Expired certificates, delayed requalification, or unresolved environmental findings can become sourcing blockers faster than cost changes.
More mature dashboards also account for signal timing. Some metrics should be reviewed weekly, while audit and certification trends may be assessed monthly or quarterly.
If every metric runs on the same reporting rhythm, fast-moving risk can stay hidden until the escalation window has already closed.
How do Procurement insights metrics support better decisions across sectors?
The value of Procurement insights metrics increases when sourcing decisions span multiple industrial systems. That is now common across mobility, electronics, agri-tech, and infrastructure programs.
A motor controller issue may involve electronics packaging, precision tooling, thermal materials, software validation, and compliance documentation. Risk never stays in one silo for long.
In that setting, metrics help standardize judgment. They create a shared basis for deciding whether to qualify an alternate source, increase buffer inventory, or redesign a component path.
They also improve conversations with engineering and operations because the discussion moves from opinions to evidence. A rising nonconformance trend carries more weight than a general concern.
Where GIM-style benchmarking becomes especially useful is in translating technical variation into procurement clarity. International standards, process capability, and field performance are viewed together.
That combined view is often the difference between reacting late and intervening while options still exist.
If you are refining your metric set now, where should you start?
Start with the suppliers, materials, and assemblies that create the highest operational dependency. High spend alone is not enough. Impact on continuity should come first.
Then review whether your current Procurement insights metrics are leading or lagging. If most metrics explain yesterday’s failure, the model is too late.
A practical first-step checklist can help:
- Map critical parts to single-source, dual-source, and shared sub-tier exposure.
- Set alert thresholds for volatility, not only averages.
- Link each metric to a decision action, such as escalation, stock review, or requalification.
- Validate technical and compliance data against recognized standards and audit evidence.
- Reassess the dashboard quarterly as market conditions and product architectures change.
The strongest Procurement insights metrics programs are rarely the largest. They are the ones built around decision relevance, cross-sector comparability, and timely escalation.
That is the practical takeaway. When metrics reveal technical weakness, capacity strain, or governance drift early enough, sourcing decisions become more resilient and far less reactive.
The next move is straightforward: define the few indicators that truly predict disruption, compare them across your most exposed supply categories, and use that evidence to tighten qualification, monitoring, and contingency planning.
The Archive Newsletter
Critical industrial intelligence delivered every Tuesday. Peer-reviewed summaries of the week's most impactful logistics and market shifts.